
Human brain activities can be ideally modeled using networks and signals supported on networks. Each node in the network represents a brain region of similar functionality, signals denote the level of activity of each brain region, and the network describes structural connectivity or functional similarity. Such an interpretation motivates the application of traditional signal processing and graph signal processing methods to examine patterns of brain activation. I have been exploiting this connection to apply signal processing tools to recognize patterns associated with differences in human behaviors and abilities. Some specific and interesting observations have been found.
In terms of temporal domain, we found that when individuals are unfamiliar with a task, good learners exhibit more and more frequent variations in brain activities for each brain regions. Their brain activities are also more unpredictable. This correlates with the intuition that stronger variation implies better adaptation and therefore faster learning. The association is not clear when subjects are familiar with the tasks. Regarding spatial domain, we found that it favors learning to have more smooth, spread, and cooperative brain activities across the brain when we face an unfamiliar task. As we gradually become familiar with the task, the smooth and cooperative signal distribution gets accumulated. When we become highly familiar with the task, it is better and favors further learning to have varied, spiking, and competitive brain signals across the brain. In a different experiment motivated to study attention switching, we found that for subjects with stronger varied, spiking, and competitive brain signals, they tend to be slower in switching their attentions.
In specific, we consider networks represented by $\mathcal{G} = (\mathcal{V}, \mathcal{E}, W)$, where $\mathcal{V} = 1, 2, \dots, N$ is a set of vertices, $\mathcal{E} \subset \mathcal{V} \times \mathcal{V}$ denotes the set of edges, and $W: \mathcal{E} \rightarrow \mathbb{R}_+$ records the edge weight denoting the similarity between a pair of nodes. We use adjacency matrix $\mathbf{A}$ to represent the network structure, where $A_{i, j} = W(i, j)$ if $(i, j) \in \mathcal{E}$ and $A_{i, j} = 0$ otherwise. The central building block from Graph Signal Processing (GSP) is Graph Fourier Transform (GFT), which considers the eigen-decomposition of $\mathbf{A} = \mathbf{V} \mathbf{\Lambda} \mathbf{V}^H$. Given a graph signal $\mathbf{x} \in \mathbb{R}^N$ denoting the value for each vertex in the graph, GFT transforms signal in the graph node domain into frequency information in the graph frequency domain,
\begin{align}
\tilde {\mathbf{x}} = \mathbf{V}^H \mathbf{x}.
\end{align}
The inverse Graph Fourier Transform (iGFT) is defined to recover the graph signals from the graph frequency coefficients,
\begin{align}
\mathbf{x} = \mathbf{V} \tilde{\mathbf{x}}.
\end{align}
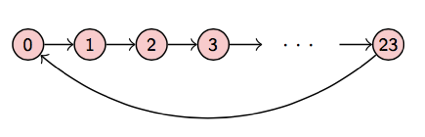
An important property about GFT is that when the underlying graph is a directed chain, as the structure in conventional time series, GFT is the same as Discrete Fourier Transform (DFT). Therefore, similar as in conventional time series analysis, graph frequency coefficients $\tilde{\mathbf{x}}$ represent the signal concentration on components that are smooth or varied with respect to the graph structure $\mathcal{G}$. We call the smooth graph signal components as the graph low frequency, and the varied graph signal components as the graph high frequency.
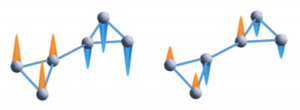
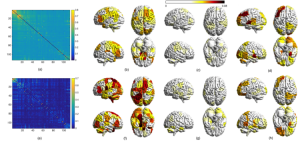
We could design graph low-pass filters $\mathbf{H}_{\text{L}}$ which only keep the graph low frequency components $\tilde{\mathbf{x}}_{\text{L}} = \mathbf{H}_{\text{L}} \mathbf{x}$, and graph high-pass filter $\mathbf{H}_{\text{H}}$ keeping the graph high frequency components $\tilde{\mathbf{x}}_{\text{H}} = \mathbf{H}_{\text{H}} \mathbf{x}$. We are going to perform such analysis for each participant, and examine the association between the concentration in graph low/high frequency components and individual differences across participants.
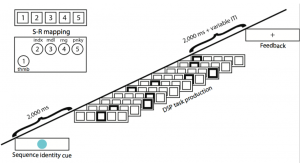
We consider two experiments. The first experiment is motivated from learning new skills, e.g. learning how to play a guitar. Some of us are very good at learning new stuff, whereas others need to build a foundation before they could grasp the task. The participants are asked to respond to stimulus on a screen by pressing the corresponding button using their right fingers. The next square in the sequence appears once the previous one has been pressed correctly. Graph signals are functional MRI (fMRI) measurements, and the network represents the similarity between the activities for a pair of brain regions.
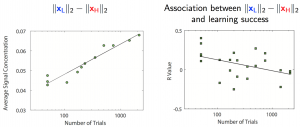
We found when we face unfamiliar tasks, subjects with strong concentration on graph low frequency components — signals that do align well with the networks — tend to learn faster. In the same time, our signals do not exhibit strong concentration on graph low frequency components. As we become more and more familiar with the task, low graph frequency components get accumulated, i.e., signal concentration on these components gradually increase with familiarity of the task. Therefore, low graph frequency components can be considered as the big picture participants are building during the learning process. Once participants become highly familiar with tasks, it is the graph high frequency components — signals that do not align well with the networks and can be interpreted as fine tuning — that makes subjects better at further learning.
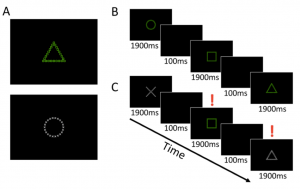
The second experiment is motivated from switching attentions. Some of us are good at switching our attentions, e.g. they could talk to their grandmother in the previous second and start to write an email in the next second, while others are not very good at this. To study such individual differences, we designed an experiment where there are images of different colors. In the example, the green one is a triangle consisted of squares, and the white one is a circle consisted of crosses. When the image is green, participants are asked to respond to the big picture — triangle in this example, and when the image is white, participants are asked to respond to the fine details — crosses in this example. There are two types of sequences, where in the first type, participants always respond to the big picture, or the fine details; in the second type, participants need to switch their attention by responding alternatively to the big picture and the fine details. Graph signals are fMRI measurements, and the network denotes the number of neuron connections between a pair of brain regions.
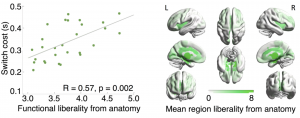
We would like to use GSP tools to study which graph frequency components is associated with faster or slower attention switching. We found that for participants with higher signal concentration on high graph frequency — signals do not align with the network, they tend to switch attention slower. Recall in the first experiment, we found that when subjects are unfamiliar with a task, higher concentration in high graph frequency implies slower learning. Therefore, we have similar findings in different experiments.